

d
deck.gl
WebGL-powered data visualization
Maintained by Vis.gl
A GPU-powered framework for visual exploratory analysis of large datasets. Integrates with MapLibre GL JS as a base map layer for high-performance geospatial visualizations.
Live demo
deck.gl running on MapLibre GL JS in your browser
Loading the map…
Demo code
import { MapLibreOverlay } from "@deck.gl/maplibre";
import { ArcLayer, ScatterplotLayer } from "@deck.gl/layers";
import type { PluginDemo } from "../types";

export default {
  center: [8, 48], // Europe
  zoom: 3.6,
  pitch: 40,
  run({ map }) {
    const cities = [
      { name: "Berlin", coordinates: [13.405, 52.52] },
      { name: "London", coordinates: [-0.1276, 51.5072] },
      { name: "Paris", coordinates: [2.3522, 48.8566] },
      { name: "Madrid", coordinates: [-3.7038, 40.4168] },
      { name: "Rome", coordinates: [12.4964, 41.9028] },
      { name: "Warsaw", coordinates: [21.0122, 52.2297] },
      { name: "Stockholm", coordinates: [18.0686, 59.3293] },
    ];
    const [berlin, ...others] = cities;

    // deck.gl layers drawn into MapLibre's own WebGL context, between the map's layers.
    map.addControl(
      new MapLibreOverlay({
        interleaved: true,
        layers: [
          new ArcLayer({
            id: "arcs",
            data: others,
            getSourcePosition: () => berlin.coordinates as [number, number],
            getTargetPosition: (d) => d.coordinates as [number, number],
            getSourceColor: [0, 128, 255],
            getTargetColor: [255, 64, 64],
            getWidth: 3,
          }),
          new ScatterplotLayer({
            id: "cities",
            data: cities,
            getPosition: (d) => d.coordinates as [number, number],
            getRadius: 30000,
            getFillColor: [255, 140, 0],
          }),
        ],
      }),
    );
  },
} satisfies PluginDemo;
Used by 2 products

CARTO
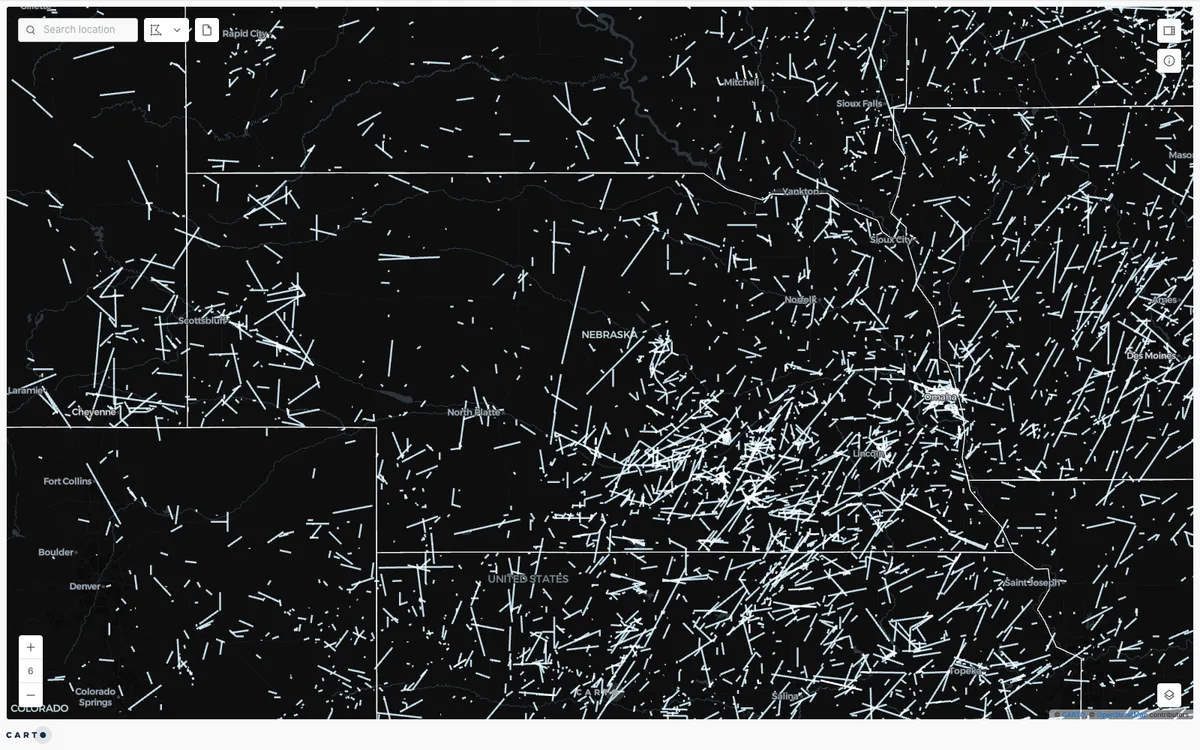
CARTO's default basemap and deck.gl examples are rendered with MapLibre GL JS, providing flexible open-source maps across their platform.
GL JS · Web

FSQ Spatial Desktop
Foursquare Studio / FSQ Spatial Desktop uses MapLibre GL JS for its vector basemaps and deck.gl integration, enabling large-scale geospatial visualizations in the browser.
GL JS · Web