


Plotly Studio is an AI-native app that turns raw data into interactive analytics apps and dashboards, as a desktop app or embedded in Dash apps. Its map charts are Plotly figures, which render with MapLibre GL JS through plotly.js.
More gis & analytics products
All gis & analytics →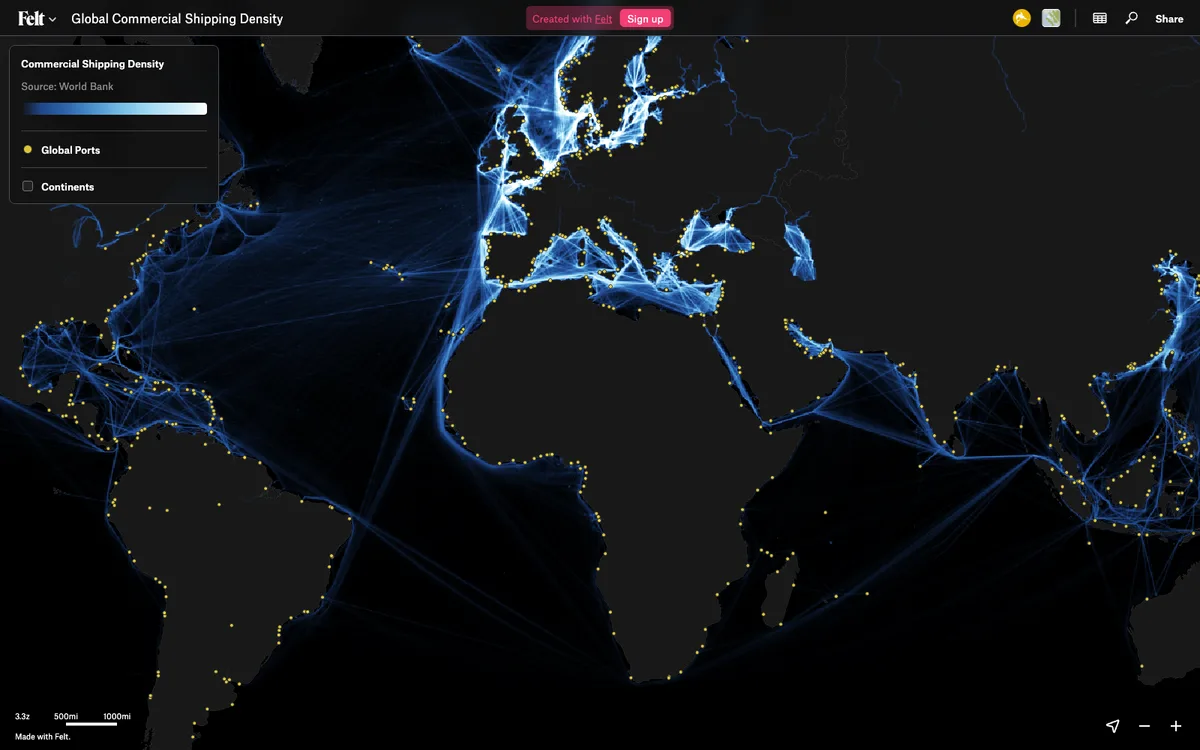

Felt
Felt lets teams upload any geodata, run spatial analysis and build dashboards in the browser. The live map canvas is rendered with MapLibre GL JS.
GL JS · Web · Story
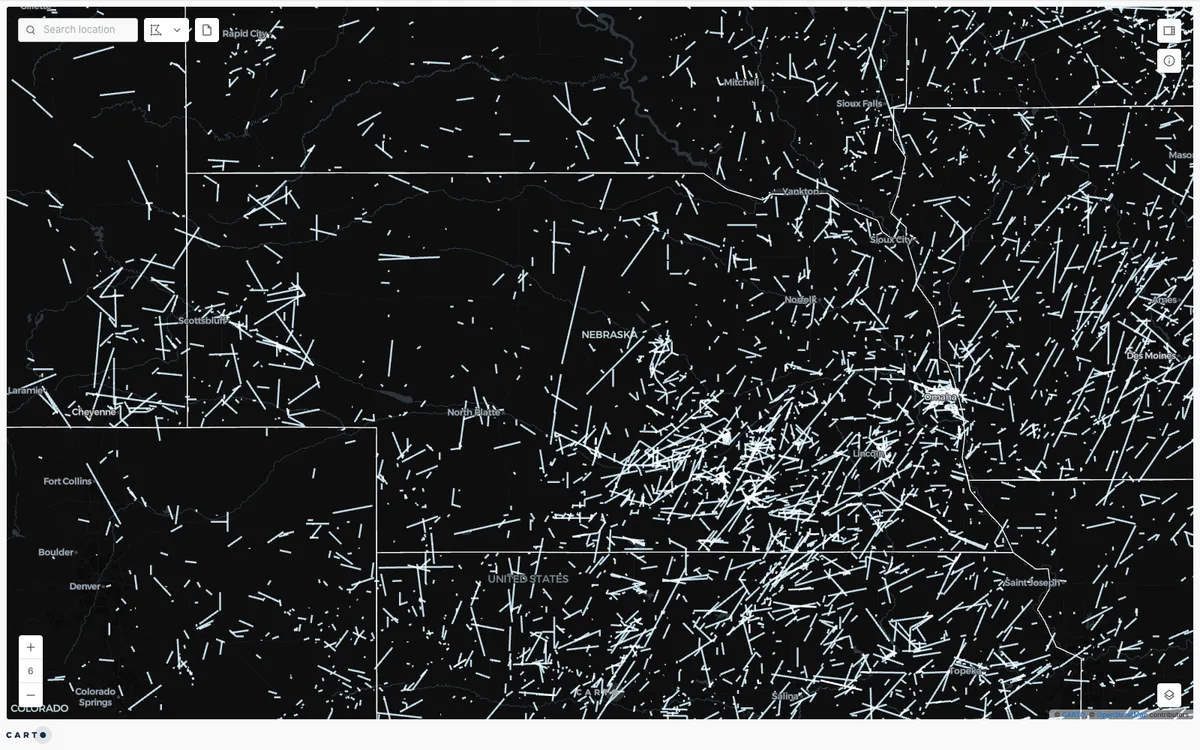

CARTO
CARTO's default basemap and deck.gl examples are rendered with MapLibre GL JS, providing flexible open-source maps across their platform.
GL JS · Web
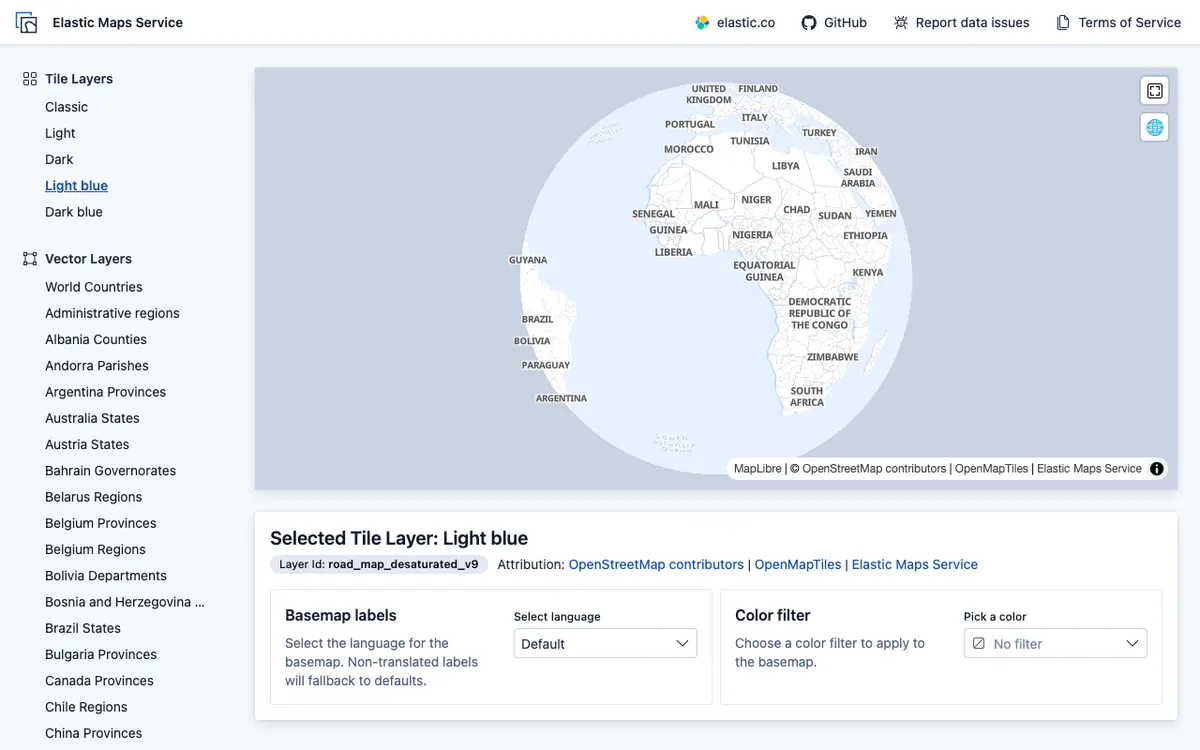

Elastic Maps
Elastic Maps provides powerful geospatial analytics and visualization capabilities built on MapLibre GL JS for interactive data exploration.
GL JS · Web